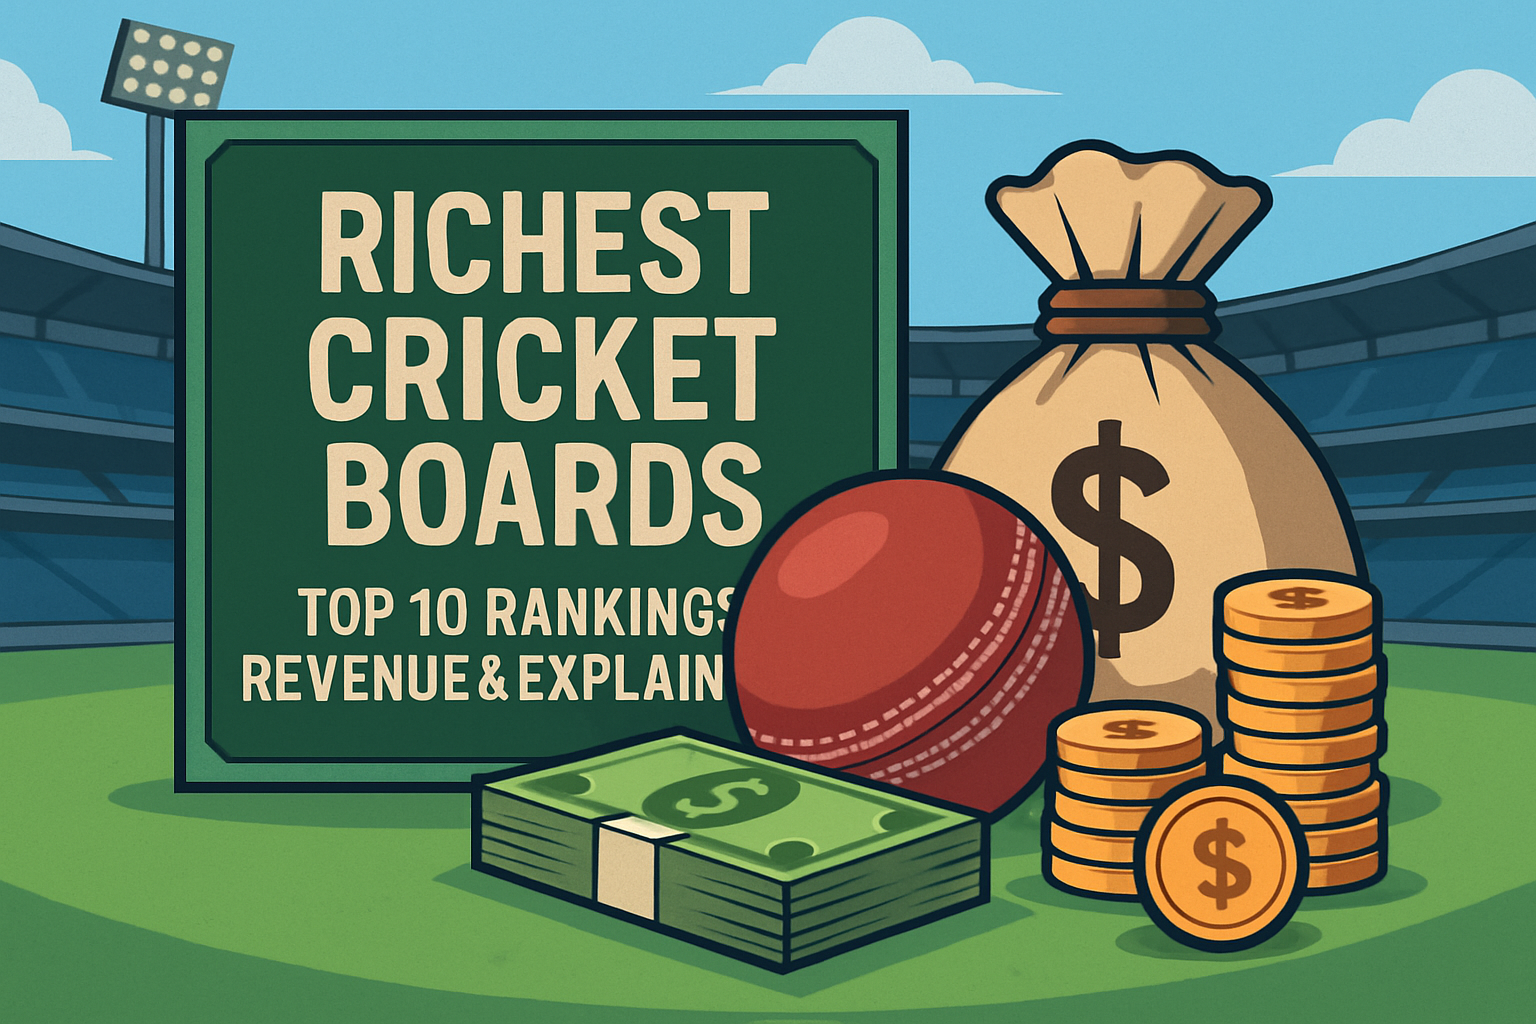
The balance sheet of international cricket is a living, breathing thing. It shifts with every media deal, every packed Sunday at the Oval, every India tour that turns a host board’s finances from anxious to upbeat. It changes with the push and pull between national boards, private leagues, broadcast partners, and the International Cricket Council’s distribution model. If you’ve ever wondered why some boards look financially bulletproof while others run on razor-thin margins, this is the full picture—how cricket really pays for itself, who makes what, and why the richest cricket boards keep pulling away.
I’ve spent the past decade speaking to broadcasters, board officials, agents, and franchise executives, and poring over annual reports, consolidated accounts, and rights announcements. What follows is an expert’s-eye view: not a quick list, but a structured, sourced, and candid look at money in cricket, from the behemoth that is the BCCI to the intimate budgets of smaller full members. It includes a ranking by estimated annual revenue, board-by-board analysis, and the mechanics that actually drive those numbers—ICC distributions, bilateral series TV deals, league economics, and match-day income.
Methodology and what “revenue” means in cricket
Scope: “Revenue” refers to the top-line annual income a national board or federation generates from its core activities—media rights (bilateral home internationals), shares of ICC distributions, central league revenues where applicable (IPL, BBL, PSL, The Hundred, SA20, etc.), sponsorship/partnerships (team and event), ticketing and hospitality from home internationals, licensing/merchandise, and other operating income. It does not refer to the “net worth” of a board; that term is imprecise in this context.
Sources: Latest publicly available board accounts, ICC announcements and member circulars, broadcaster and league tender outcomes, sponsor announcements, and reporting by reliable outlets (ESPNcricinfo, The Times, The Australian, Financial Times/Financial Express/Mint, Reuters, Guardian, BBC, Sky, The Hindu/BusinessLine, Cricbuzz).
Currency and conversions: Estimates are presented in USD for comparability, using rounded market rates and, where needed, multi-season rights values averaged to an an-nual figure. Because some boards report in different currencies and on different fiscal calendars, figures are expressed as ranges to reflect uncertainty and exchange-rate drift.
Caveats: Numbers can swing materially year to year based on touring patterns (an India men’s tour to your country often doubles your season’s media and gate income), league cycles, and extraordinary items (e.g., government grants, one-off settlements, or Covid-era adjustments). Treat these as directional, with ranges reflecting conservative to optimistic outcomes under the current cycle.
How cricket boards make money
Cricket’s cash comes from a small number of high-impact taps:
Bilateral media rights for home internationals:
The single biggest board-controlled asset. One long India series at home can be worth more than two entire seasons against other opposition in some markets. These rights are typically sold in multi-season bundles across television, digital, and sometimes audio.
Central league rights:
Where the national board owns and operates a top domestic league or has a majority economic interest, the central media and sponsorship pool can dwarf everything else. The IPL is the headline example, but the BBL, PSL, The Hundred, and SA20 all contribute meaningful sums. In most models, the central pool pays franchises, the board, and—sometimes—state associations.
ICC revenue distributions:
The ICC sells global rights to its men’s and women’s events and distributes a member share according to a controversial formula weighted heavily toward the BCCI. For many boards, this distribution is a financial bedrock that funds grassroots and high performance.
Sponsorships and partnerships:
Team front-of-shirt deals, sleeve sponsors, kit suppliers, series title partners, and official partners (banking, airlines, beverages, tech) add up. The elasticity of these deals tracks closely with performance, star power, and TV reach.
Ticketing and hospitality:
Full houses for marquee Tests and T20Is, long member waitlists, and premium hospitality programs can be worth tens of millions each cycle to top boards. Smaller markets earn modest but essential match-day cash.
Licensing, events, and other income:
Licensing (video games, collectibles), stadium rentals, and miscellaneous event fees fill in the gaps. Associates may also rely on government grants or Olympic committees when applicable.
Costs matter too: central and state contracts for men and women; operating domestic competitions; stadium maintenance; coaching and pathways; women’s cricket programs; and performance costs for national teams. Rich boards can ring-fence long-term investment; leaner boards often live season to season.
The ICC distribution model, in plain English
The ICC’s current financial cycle allocates the bulk of members’ money from global tournament rights into an annual distribution. The BCCI receives by far the largest share—widely reported in the high-thirty-percent range of the members’ pool—based on a formula linked to cricket economy size, audience, and historical weighting. The ECB and Cricket Australia slot next with mid-single-digit shares each. The PCB, CSA, SLC, BCB, NZC, and CWI receive smaller slices, followed by Zimbabwe, Afghanistan, Ireland, and the rest of the associates.
Ballpark annual distributions reported by reliable outlets under the current model (USD, rounded):
- BCCI: around the low two hundreds of millions
- ECB and CA: roughly forty-ish million each
- PCB: mid-thirties
- CSA and BCB: mid-to-high twenties
- SLC: mid-twenties
- NZC and CWI: mid-to-high teens
- Zimbabwe: low teens
- Afghanistan: a little under that
- Ireland: high single digits
This money underwrites everything from central contracts and match operations to academy pathways. For smaller boards, the ICC cheque is the difference between strategic breathing space and constant firefighting.
The richest cricket boards — latest ranking by estimated annual revenue
This ranking blends ICC distributions, bilateral rights, league monies, sponsorships, and match-day income. Ranges reflect realistic variability across a typical cycle.
Comparison table: richest cricket boards, latest estimated annual revenue (USD)
| Board | Est. annual revenue | Key drivers | Basis |
|---|---|---|---|
| BCCI (India) | $900m–$1.2b | IPL central rights share, India home bilateral rights, ICC distribution, mega sponsorships, packed gates | IPL rights announcements; BCCI media rights; ICC distribution reports; sponsor disclosures |
| ECB (England and Wales) | $400m–$500m | Long-term pay‑TV deal, The Hundred rights/sponsors, ICC distribution, strong ticketing/hospitality | ECB/Sky announcements; UK press; ICC distribution reports |
| Cricket Australia | $350m–$450m | Domestic broadcast deal, Big Bash rights, India tours, ICC distribution, sponsorships/match-day | Seven/Foxtel deal; CA annual reporting; ICC distribution reports |
| Cricket South Africa | $140m–$180m | SA20 central revenues, domestic broadcast income, ICC distribution, sponsorship | CSA statements; SA20 commercial model; SuperSport reporting; ICC distribution |
| Pakistan Cricket Board | $120m–$160m | ICC distribution, PSL central pool net to board, domestic rights, sponsorships, gates for marquee tours | PCB briefings; PSL rights/sponsorship reporting; ICC distribution |
| Bangladesh Cricket Board | $80m–$110m | ICC distribution, bilateral rights, BPL central revenues, sponsorships, domestic gates | BCB media rights announcements; ICC distribution; local press |
| New Zealand Cricket | $65m–$85m | ICC distribution, bilateral rights, especially when India tours, sponsorships, match-day | NZC financial statements; media rights reporting; ICC distribution |
| Sri Lanka Cricket | $45m–$70m | ICC distribution, bilateral rights, LPL central revenues, sponsorships | SLC disclosures; LPL commercial data; ICC distribution |
| Cricket West Indies | $40m–$60m | ICC distribution, bilateral rights, sponsorships, ticketing in key venues | CWI reporting; regional broadcast deals; ICC distribution |
| Zimbabwe Cricket | $20m–$30m | ICC distribution, limited bilateral rights, sponsorships | ZC accounts where available; ICC distribution; media reports |
Chasing pack (not in the ten above): Afghanistan Cricket Board, Cricket Ireland, Netherlands Cricket Board, Scotland—mostly reliant on ICC money plus smaller domestic deals and event-driven peaks when they host major nations or qualify for global events.
BCCI: why India sits on a financial mountain
The Board of Control for Cricket in India is the richest cricket board by a distance so great that comparisons almost feel unkind. The reasons are structural:
- The IPL effect: Central IPL media rights exploded in the latest cycle, with digital bidders forcing a step change in valuation. The central pool—after franchise distributions—still leaves the BCCI with a massive annual take. That, plus sponsorships (title partners, category partners, fantasy, payments, tech) and licensing around the IPL ecosystem, creates a self-sustaining engine.
- Bilateral rights: India’s home internationals are the most valuable inventory in the sport. Every ball is monetizable across television and digital with extraordinary reach. Broadcasters treat these rights as must-have, marquee content to anchor subscriber growth.
- Sponsorship and match-day: The India men’s team is a marketer’s dream, and the board has steadily stacked blue-chip partners—kit, lead sponsors, and series title sponsors. Gates and hospitality are formidable at flagship venues like Eden Gardens, Wankhede, Chinnaswamy, and the mammoth stadium in Ahmedabad.
- ICC distribution: The ICC’s member-share model disproportionately rewards the BCCI for its outsized role in the cricket economy. That cheque alone would constitute a top-line budget for most full members.
There’s nuance though. The BCCI’s outflows are also large—state association grants, massive event operations for IPL and internationals, and growing investment in women’s cricket. But the surplus headroom is such that even lean touring years seldom push the board into austerity. The richest cricket board in the world will remain India as long as the IPL and India’s bilateral inventory command record-breaking bids.
ECB: a media machine built on stability and premium match-day
The ECB built financial predictability around a long-term partnership with pay-TV, supported by carefully curated free-to-air windows. That balance keeps elite rights values high while maintaining cultural reach. The Hundred added a new property with central sponsorship inventory and a fresh demographic target, while England’s men’s Test summers continue to deliver full houses and premium hospitality sales.
Key drivers:
- The Sky deal is the spine; it covers multi-format England series and The Hundred, providing annuity-like income.
- Ticketing and hospitality at Lord’s, The Oval, and major grounds drive per‑match revenue few countries can match.
- Strong sponsor roster across men’s and women’s teams, plus event partners for The Hundred.
- Reliable ICC distribution to underpin high performance and grassroots funding.
The ECB’s risk is less about topline and more about cost control and renewal: keeping The Hundred vibrant, managing scheduling fatigue, and ensuring women’s cricket has sustained investment without cannibalizing other business lines. In pure income terms, England sits comfortably as the second most valuable board.
Cricket Australia: big markets, big summers, and Big Bash recalibration
Australia’s rights strategy leans on a robust domestic broadcast deal that bundles internationals and the Big Bash with linear and streaming partners. When India tours, CA’s season becomes a financial carnival—gate receipts skyrocket, premium hospitality sells out, and sponsors activate at scale.
Key drivers:
- A long-term domestic media agreement with free-to-air highlights and deep pay-TV investment anchors revenue. The Big Bash, once the growth engine, has been recalibrated to balance quality, length, and broadcast value.
- ICC distribution and commercial partners add stability.
- Match-day excellence at the MCG, SCG, Adelaide, Perth, and Brisbane aims for maximum yield per seat, not just raw attendance.
The strategic question in Australia has been how to boost the Big Bash without overspending on star availability. The introduction of a draft, schedule trimming, and better windows have helped, especially as private T20 leagues compete for the same calendar space.
Cricket South Africa: the SA20 lifeline and a more balanced portfolio
CSA’s finances were under real strain not long ago. The launch of SA20, anchored by a strong domestic broadcaster and IPL-owner capital, has changed the conversation. The league brings central rights money, title sponsorship, and a revenue-sharing model that keeps CSA materially involved in the upside.
Key drivers:
- SA20 central revenues: broadcast, sponsorships, and fees—plus the knock-on effect of increased attention in a crowded market.
- Domestic TV with SuperSport for internationals, the most reliable source of income after SA20.
- ICC distribution and a renewed sponsor ecosystem.
CSA’s long-term resilience depends on keeping SA20 competitive in the global franchise landscape and maintaining international cricket’s broadcast value. The early signs are positive: higher-quality overseas pros, packed Newlands nights, and improved brand heat.
Pakistan Cricket Board: PSL star power, ICC backbone, and a domestic rebuild
The PSL changed the PCB’s commercial prospects. It brought in sponsors and broadcasters keen on prime-time T20 and gave the board a marquee asset on home soil. The new cycle’s PSL domestic and international rights, plus central sponsorships, put reliable cash in the PCB’s pocket after team distributions. The ICC distribution remains vital. Domestic bilateral rights and sponsorships are respectable, but the absence of India as a bilateral touring partner hurts both revenue and sentiment.
Key drivers:
- PSL central pool net to PCB, with significant brand recall and viewership in Pakistan and the diaspora.
- ICC distribution in the mid-thirties (USD millions) range under current models.
- Bilateral rights for home internationals, plus substantial gates for major visiting teams.
Pakistan’s budget is healthy enough to support coaching pathways, women’s cricket growth, and improved domestic infrastructure, but still more volatile than boards with richer home media markets or India tours locked in.
Bangladesh Cricket Board: a passionate market that keeps growing
Bangladesh’s cricket economy is powered by a large, engaged audience and an improving commercial landscape. The ICC distribution is meaningful, bilateral home rights have found steady buyers, and the Bangladesh Premier League—despite format and governance hiccups—brings in central sponsorship and broadcast money.
Key drivers:
- ICC distribution comfortably into the mid-to-high twenties (USD millions).
- Bilateral rights with stable broadcasters in a rapidly digitizing market.
- BPL central revenues and team fees, plus a sponsor ecosystem that punches above its GDP weight.
BCB’s trajectory is upward. As more content migrates to digital and as the national team sustains white-ball relevance, sponsors and streaming platforms continue to invest.
New Zealand Cricket: small market, smart scheduling, and the India effect
NZC is a case study in optimization. It squeezes remarkable value out of a small domestic market by careful scheduling, especially around India’s occasional visits, and by being nimble with broadcast partners. Sponsorships focus on quality over quantity, and match-day income is optimized through right-sized venues.
Key drivers:
- ICC distribution in the mid-to-high teens (USD millions).
- Bilateral rights that spike when India tours; otherwise well-managed, if modest.
- Consistent, brand-safe sponsors and community engagement.
NZC lives comfortably within its means, investing heavily in pathways and women’s cricket while accepting that its market ceiling is lower than the Big Three.
Sri Lanka Cricket: rebuilding confidence and monetizing talent
SLC’s finances have ridden waves—periods of fiscal stress followed by stabilizing rights cycles. The LPL has slowly matured, bringing in central rights revenue and raising the board’s bargaining power with sponsors. ICC money remains a bedrock, while bilateral rights are solid, if not spectacular.
Key drivers:
- ICC distribution in the mid-twenties (USD millions).
- Bilateral rights sold to regional giants; decent match-day incomes when big teams visit.
- LPL central pool and sanction fees, improving year on year.
Financial discipline and transparent governance remain the biggest levers for SLC to unlock higher sponsorship tiers and rebuild long-term reserves.
Cricket West Indies: tradition, talent, and the search for a modern income mix
The West Indies have a global brand and a small, fragmented media market. That paradox defines CWI’s commercial journey. The ICC distribution pays the bills; bilateral rights and sponsorships add layers; match-day revenues peak for touring heavyweights and marquee venues like Kensington Oval and Sabina Park. The CPL is privately operated, limiting direct board monetization beyond sanctioning and hosting benefits.
Key drivers:
- ICC distribution in the mid-to-high teens (USD millions).
- Bilateral rights across a patchwork of Caribbean markets.
- Sponsorships, ticketing, and hospitality that flare for major series.
Financially, the focus is on stability and strategic relationships—aligning the domestic calendar with global franchise windows, making the men’s red-ball side competitive again, and building a sustainable women’s program.
Zimbabwe Cricket: survival mode to cautious rebuilding
Zimbabwe’s cricket economy relies primarily on ICC distributions, supplemented by bilateral rights, local sponsors, and government goodwill. Qualifying for ICC events brings exposure and occasional windfalls; hosting major teams provides essential match-day income. Progress is slow but more consistent than in the recent past.
Key drivers:
- ICC distribution in the low teens (USD millions).
- Bilateral rights and local sponsorships.
- Development grants and careful cost control.
For Zimbabwe, steady governance and incremental gains mean more than chasing a quick revenue spike.
BCCI vs ECB vs CA: a clean comparison of the top three
Scale:
India’s total cricket economy is multiple times larger than England’s or Australia’s. Even if the BCCI relied solely on IPL central revenues and ICC distributions, it would still likely out-earn any other board’s entire portfolio.
Predictability:
England has the steadiest cash flows thanks to a long-term pay‑TV spine and elite ticketing yields. Australia’s season-to-season swing is more pronounced—monster summers when India tours, comparatively quieter otherwise.
Growth engines:
India’s growth engine is digital monetization around the IPL and India internationals; England’s is maximizing premium hospitality and The Hundred’s commercial maturation; Australia’s is stabilizing the Big Bash’s quality and leveraging streaming growth.
How leagues shape board finances: IPL, BBL, PSL, The Hundred, SA20
IPL:
The central rights package is the sport’s biggest commercial asset. The board takes a significant share of the central pool after franchise distributions and state association grants. Sponsorships around the league operate at a level no other national competition can match. The IPL doesn’t just make the BCCI rich; it subsidizes pathways, women’s cricket expansion, and infrastructure across India.
BBL:
A crucial component of CA’s rights bundle. Its value peaked and then required recalibration—shorter season, better overseas availability, and a tighter narrative. The BBL still delivers strong family audiences and advertiser-friendly slots, anchoring summer coverage between Test matches.
PSL:
A premium T20 product in a passionate market. Strong domestic ratings and competitive quality have kept rights and sponsorship healthy. PCB’s share of the central pool, after distributions to franchises, is essential, and the league’s scheduling now tries to avoid direct clashes with bigger global windows.
The Hundred:
Controversial at launch but commercially meaningful. A central rights and sponsorship platform that allows the ECB to diversify audiences, experiment with format and broadcast innovation, and build fresh brand assets. The board’s job is to keep it distinctive without overshadowing the County T20.
SA20:
Perhaps the most strategically important league outside India for a national board. IPL-owner capital and a strong broadcaster have created a sustainable, high-quality product that boosts CSA’s finances, rebuilds fan engagement, and brings in overseas star power without excessive costs.
Others:
CPL, LPL, BPL, and emerging leagues provide valuable but smaller central revenues. They matter most to their home boards as brand platforms and sponsor magnets, even if the direct financial returns are not IPL-sized.
How the ICC’s model keeps widening the financial gap
The current ICC distribution formula, by design, directs the largest share to India. The rationale is clear: India drives the overwhelming majority of global cricket viewership and commercial interest. The second-order effects are equally clear: boards with smaller domestic markets grow more dependent on ICC funds and touring patterns, while their ability to invest long-term lags the Big Three.
This isn’t purely a tale of inequity; it’s a tale of market reality. But it does create structural challenges:
- Smaller boards struggle to retain talent in domestic competitions when private leagues offer higher seasonal pay.
- High-performance programs for women and youth often rely on ICC funding and can be the first to feel cuts during lean cycles.
- In bad calendar luck—no India tour, fewer marquee visits—a board may suddenly face liquidity issues.
Women’s cricket and its impact on board budgets
Women’s cricket is transitioning from “cost center” to “strategic asset.” Boards that committed early—central contracts, broadcast coverage parity, standalone windows—are now seeing sponsor interest grow. England’s women’s game anchors The Hundred’s proposition; Australia’s WBBL is a globally envied model; India’s Women’s Premier League created an instant commercial market and a new revenue channel for the BCCI.
Financially:
- Short-term: Women’s cricket adds costs—contracts, staffing, facilities, scheduling—but these are investments with rising commercial returns.
- Medium-term: Broadcasters and sponsors increasingly demand women’s inventory baked into deals. Boards that deliver high-quality women’s content gain leverage.
- Long-term: Participation growth and fan diversification translate into bigger rights renewals across the whole portfolio.
Associate and emerging members: who funds what and why it matters
Associates rely on a mix of ICC distributions, targeted grants, government support, and event-driven surpluses when they qualify for global tournaments. The ICC’s development programs prioritize high-performance pathways, facilities, and tournament participation. For boards like the Netherlands, Scotland, Nepal, Oman, or USA, a bumper tournament run can change the budget outlook for an entire cycle. Private leagues (like ILT20 in the UAE or MLC in the USA) further complicate the picture by bringing sponsorship, broadcast attention, and some board-adjacent income without always flowing centrally through the national federation.
Currency, inflation, and why comparisons are tricky
- Rights are signed in local currencies; USD conversions swing with exchange rates. A stable domestic deal can appear to gain or lose value in USD terms without any change to the underlying contract.
- Inflation affects everything—security, travel, stadium operations, insurance—eroding real margins even as top-line numbers look larger.
- One India tour is a financial season in itself. Boards with full houses and premium hospitality options see a step-change in match-day profit that doesn’t show up on a neat, flat annual average.
Country-by-country deep dives
India (BCCI)
Estimated annual revenue: $900m–$1.2b
Why so high: IPL central rights are a category of one, and bilateral rights for India home internationals remain the crown jewels of cricket broadcasting. Add the ICC money, sponsorship depth (from kit to digital categories), and the highest match-day capacity in the sport, and you have an unmatched portfolio. The BCCI’s model also channels funds to state associations and infrastructure, spreading the game’s footprint and creating more stadiums that print money on big nights. The Women’s Premier League is a new growth engine, already attracting premium partners and strong ratings.
England and Wales (ECB)
Estimated annual revenue: $400m–$500m
What sets it apart: The strength of a long-term broadcast partnership, elite Test venues that sell premium corporate hospitality, and a sponsor stable that trusts the ECB to deliver both tradition and innovation. The Hundred gives the ECB a second summer tentpole to complement England men’s and women’s internationals, while the women’s game is a strategic pillar in its own right. The pathway and county system are expensive, but they keep England’s content pipeline full.
Australia (Cricket Australia)
Estimated annual revenue: $350m–$450m
How it works: A high-value domestic rights deal underwrites the summer, with the Big Bash as a mainstream product and men’s Tests as a national ritual. When India tours, the numbers go off the charts—attendance, hospitality yields, and broadcast ratings. CA’s commercial team focuses on sticky categories (banking, telco, beverages) and balancing free-to-air reach with subscription revenue. The women’s pathway and the WBBL sit at the heart of its long-term plan.
South Africa (Cricket South Africa)
Estimated annual revenue: $140m–$180m
The turnaround: SA20 changed CSA’s economics from fragile to credible. Securing stake-holding IPL owners raised quality and marketing muscle; a strong domestic broadcaster did the rest. Bilateral rights and the ICC distribution fill out the budget. The focus now is consistency: safeguard SA20’s window, keep internationals attractive to broadcasters, and invest in pathways that keep the Proteas competitive.
Pakistan (Pakistan Cricket Board)
Estimated annual revenue: $120m–$160m
The engine: PSL remains Pakistan’s most bankable sports asset—appointment-viewing in a cricket‑mad nation with massive digital reach. ICC funds provide stability for national programs, while bilateral deals, especially with major touring sides, bring chunky seasonal revenues. Better scheduling, improved hosting infrastructure, and a push on the women’s game are gradually widening the PCB’s commercial base.
Bangladesh (Bangladesh Cricket Board)
Estimated annual revenue: $80m–$110m
Why it’s rising: A big, engaged fanbase and improving broadcast landscape have lifted bilateral rights and sponsorship rates. The BPL has matured into a commercially meaningful asset, and the national team’s competitiveness in white-ball cricket keeps advertisers interested. The ICC distribution remains a vital foundation, but the domestic market’s ceiling is moving higher, not lower.
New Zealand (New Zealand Cricket)
Estimated annual revenue: $65m–$85m
The approach: Precision management. NZC sequences its summers to maximize value when India visits and maintains sound relationships with sponsors who value cricket’s family-friendly image. A smaller population limits upside, but NZC’s governance and cost control are among the best in the game. In recent cycles, women’s cricket participation and visibility have grown, unlocking new sponsor categories.
Sri Lanka (Sri Lanka Cricket)
Estimated annual revenue: $45m–$70m
The challenge and the path: Balancing a moderate domestic market with a proud cricketing culture. The LPL’s central revenues and international visibility are helping, while ICC funding keeps the high-performance lights on. SLC’s commercial future depends on trusted governance, reliable scheduling, and keeping the men’s and women’s teams visible and competitive in global events.
West Indies (Cricket West Indies)
Estimated annual revenue: $40m–$60m
The reality: A storied brand, an epic history, and a patchwork commercial market. ICC money is the spine; bilateral rights and sponsors add sinew. The CPL’s value accrues mostly to private operators, though CWI gains indirectly through regional attention and cricket tourism. The board’s financial health depends on predictable scheduling, player relations, and building a women’s program that can attract new sponsors.
Zimbabwe (Zimbabwe Cricket)
Estimated annual revenue: $20m–$30m
Where it stands: ICC distributions plus modest bilateral and local sponsorship revenues. When Zimbabwe qualifies for global tournaments or hosts high-profile sides, budgets breathe easier. The focus is on steady governance, debt management, and incremental commercial growth rather than moonshots.
Are PSL and BBL profitable for their boards?
- PSL: Yes, in central terms. After franchise distributions and operational costs, the PCB still books meaningful net income from the central pool, and the league elevates the sponsor base for the wider cricket economy in Pakistan.
- BBL: It’s profitable as part of CA’s bundled rights, with value spread across the full summer package. Standalone profit/loss can vary, but as a broadcast product, it’s critical to CA’s overall rights value and sponsor mix.
Which country earns the most from cricket?
India. Between the IPL, home bilateral media rights, sponsorship scale, match-day potential, and the ICC’s distribution formula, no other board is close. The richest cricket board is the BCCI, and barring structural upheaval, that hierarchy is locked in.
Why is India richer than other boards?
- Scale of audience and advertiser demand
- IPL’s commercial gravity and global recruitment of star power
- Cultural centrality of cricket in India’s media economy
- A rights market where multiple deep-pocketed bidders compete across TV and digital
- ICC distribution tilted toward the market leader’s impact
Budget pressures that even rich boards feel
- Player availability: The global T20 economy pulls elite cricketers in multiple directions. Managing central contracts and No Objection Certificates has budget and performance implications.
- Calendar congestion: More content isn’t always more value. Dilution risk is real; smart boards curate.
- Inflation and operations: Security, travel, stadium upgrades, and insurance costs keep rising.
- Women’s cricket: An investment imperative with long-term upside but immediate cash obligations.
What could change the money map
- Streaming wars intensify: If more bidders fight for premium cricket rights, boards gain leverage. If consolidation continues, expect flatter renewals.
- Private investment in national leagues: SA20’s model and the WPL show how private capital can lift value quickly. Others may follow.
- Scheduling reform: Better global windows for domestic leagues could improve player availability and raise league valuations.
- ICC model tweaks: Any change in distribution could materially affect mid-tier boards. Don’t bet on dramatic rebalancing without broader governance reform.
FAQs — concise answers grounded in the numbers
- Which is the richest cricket board in the world?
- BCCI, by an enormous margin.
- How much is the BCCI worth?
- “Worth” is a fuzzy term for a non-profit sporting body. On annual income, the BCCI generates roughly $900m–$1.2b under the current cycle.
- How do cricket boards make money?
- Mostly via home international media rights, league central revenues, ICC distributions, sponsorships, and ticketing/hospitality. The mix varies by country.
- What is the ICC’s revenue and who gets the most?
- The ICC sells global event rights and distributes a large member pool. India receives the biggest share by far, with England and Australia next, followed by Pakistan, South Africa, Bangladesh, Sri Lanka, New Zealand, West Indies, Zimbabwe, Afghanistan, and Ireland.
- Are PSL/BBL profitable for their boards?
- Yes in central terms, though the accounting is complex. Both are key to maintaining broadcast value and sponsor interest across their home summers.
- Do women’s programs affect board budgets?
- Yes, and positively over time. They add near-term costs but deliver long-term sponsor and audience growth, especially where the women’s game is given prominent windows and broadcast coverage.
- Which country earns the most from cricket?
- India, due to the IPL, India’s bilateral rights, sponsorships, and the ICC model.
- Richest cricket board in Asia?
- India, followed by Pakistan and Bangladesh in revenue terms among Asian boards, with Sri Lanka close behind.
Key takeaways
- The BCCI’s financial scale is singular; it sets the sport’s economic weather.
- ECB and CA have built stable, premium ecosystems with strong domestic rights and match-day yields.
- CSA’s SA20, PCB’s PSL, and the ECB’s The Hundred are pivotal to mid-and-upper-tier board health.
- The ICC distribution model cements the gap between the Big Three and everyone else.
- Women’s cricket is transitioning from cost to revenue driver; boards that invest now will lead later.
- Touring patterns—especially India tours—can transform a host board’s financial year.
- Currency shifts and inflation mean that headline rights numbers can mislead; focus on real yield and diversified income.
A closing thought
Cricket’s financial map looks inevitable until it doesn’t. A new streaming entrant can reset a market; a well-run league can resuscitate a federation; a transparent, talent-forward women’s program can unlock sponsors that cricket never had. But one constant holds: the boards that treat their media rights as living assets, schedule ruthlessly, and invest in pathways—men and women—will always outperform. The richest cricket boards didn’t get there by accident. They got there by understanding that in cricket, the calendar is the balance sheet, the audience is the currency, and the product—on the field, on television, and on your phone—has to earn its value every single season.
